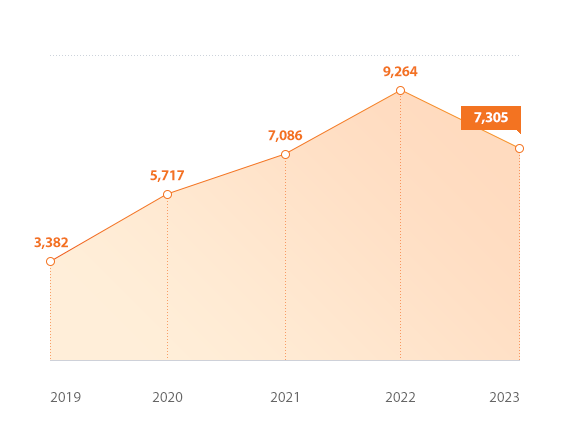
Standalone Income Statement
Unit billion KRW
Details of Standalone Income Statement
|
2021 |
2022 |
2023 |
2024 |
2025 |
| Sales |
7,086 |
9,264 |
7,341 |
6,182 |
5,740 |
| Operating profit |
550 |
893 |
58 |
-117 |
-414 |
| Net Income |
548 |
1,039 |
-264 |
-940 |
-149 |
※ The company has changed its accounting policy to recognize dividend income from subsidiaries as operating income, reflecting our involvement in their business management. Accordingly, the sepated income statement for FY2023 and FY2024 were retroactively restated.
Standalone Balance Sheet
Unit billion KRW
Details of Standalone Balance Sheet
|
2021 |
2022 |
2023 |
2024 |
2025 |
| Current assets |
3,275 |
4,400 |
3,017 |
2,681 |
3,369 |
| Non-current assets |
12,035 |
14,669 |
14,424 |
16,667 |
16,240 |
| Total assets |
15,310 |
19,069 |
17,441 |
19,348 |
19,609 |
| Current liabilities |
3,718 |
4,845 |
4,928 |
5,920 |
6,391 |
| Non-current liabilities |
3,749 |
4,292 |
3,693 |
3,088 |
2,888 |
| Total liabilities |
7,467 |
9,137 |
8,621 |
9,008 |
9,279 |
| Total equity |
7,843 |
9,933 |
8,820 |
10,340 |
10,330 |